The better way to analyze a stock
getSymbols('MSFT',src='yahoo')[1] "MSFT"
> getSymbols('SBUX')
[1] "SBUX"
> barChart(SBUX)
> addTA(EMA(Cl(SBUX)), on=1, col=6)
> addTA(OpCl(SBUX), col=4, type='b', lwd=2)
> newEMA <- newTA(EMA, Cl, on=1, col=7)
> newEMA()
> newEMA(on=NA, col=5)
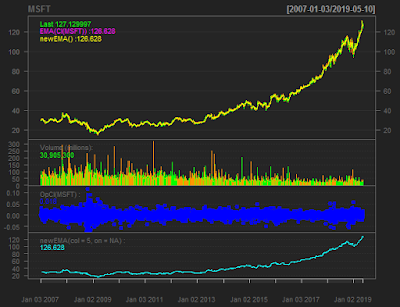
> barChart(MSFT)
> addTA(EMA(Cl(MSFT)), on=1, col=6)
> addTA(OpCl(MSFT), col=4, type='b', lwd=2)
> newEMA <- newTA(EMA, Cl, on=1, col=7)
> newEMA()
> newEMA(on=NA, col=5)


0 Comments