FX derivatives can be grouped into three main categories:
Futures, Swaps, and Options. we will only deal with option-type derivatives.The price of the underlying will always be S, but if it is not necessarily a
currency, we will use numeric or alphabetic indices such as S1
or SA
• The strike price will always be X
• The expected value operator will be denoted by E
Currency options
What is european currency option in foregin exchange?
European currency options grant the holder the right to buy (call option) or sell(put option) currency at a predetermined exchange rate (strike price or exercise price, X), on a specified date (maturity, T). These financial assets are also called foreign
exchange options (or FX options),
How to apply black schol european currency option in foregin exchange?
We can use the Black-Scholes option or the GBSOption function, both of which are practically the same, and the latter is a shorthand aliasfor the prior function.
BlackScholesOption(TypeFlag, S, X, Time, r, b, sigma,...)
Here, TypeFlag is either the character c, which stands for call or p (put). S is the
current price and sigma is the volatility of the underlying. X is the strike price and
Time is the time to maturity
The other two parameters are a bit tricky because r and b are the risk-free rates
we must set b = r to get the BS stock option model,
and set b = r-q to get the currency option model or the stock option model with
continuous dividend yield
GBSOption(TypeFlag = "c", S = 0.745, X = 0.7, Time = 5, r = 0.03, b = 0.01, sigma = 0.2)
BlackScholesOption ("c", 0.7450, 0.7, 5, 0.03, 0.01, 0.2)
Title:
Black Scholes Option Valuation
Call:
GBSOption(TypeFlag = "c", S = 0.745, X = 0.7, Time = 5, r = 0.03,
b = 0.01, sigma = 0.2)
Parameters:
Value:
TypeFlag c
S 0.745
X 0.7
Time 5
r 0.03
b 0.01
sigma 0.2
Option Price:
0.152222
Description:
Mon Apr 29 16:34:31 2019
We can also check out the price of the put option:
BlackScholesOption("p", 0.7450, 0.7, 5, 0.03, 0.01, 0.2)
Title:
Black Scholes Option Valuation
Call:
GBSOption(TypeFlag = "p", S = 0.745, X = 0.7, Time = 5, r = 0.03,
b = 0.01, sigma = 0.2)
Parameters:
Value:
TypeFlag p
S 0.745
X 0.7
Time 5
r 0.03
b 0.01
sigma 0.2
Option Price:
0.08061367
Description:
Mon Apr 29 16:35:32 2019
we can also check the consistency with the put-call parity
> c - p = S*exp(-r*T)–X*exp(-q*T)
> c - p = 0.152222 - 0.08061367=0.07160833
On the right-hand side, we have: 0.745*exp(-0.02*5)-0.7*exp(-0.03*5) = 0.07160829
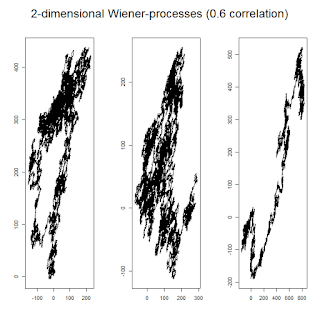
Correlation between the Wiener processes changes the picture dramatically. In the
case of positive correlation, the two Wiener processes look like they are moving in
the same direction; in the case of negative correlation, they look like they are moving
in the opposite direction.
D2_Wiener <- function() {
+ dev.new(width = 10, height = 4)
+ par(mfrow = c(1, 3), oma = c(0, 0, 2, 0))
+ for(i in 1:3) {
+ W1 <- cumsum(rnorm(100000))
+ W2 <- cumsum(rnorm(100000))
+ plot(W1,W2, type= "l", ylab = "", xlab = "")
+ }
+ mtext("2-dimensional Wiener-processes with no correlation",
+ outer = TRUE, cex = 1.5, line = -1)
+ }
> D2_Wiener()
> Correlated_Wiener <- function(cor) {
+ dev.new(width = 10, height = 4)
+ par(mfrow = c(1, 3), oma = c(0, 0, 2, 0))
+ for(i in 1:3) {
+ W1 <- cumsum(rnorm(100000))
+ W2 <- cumsum(rnorm(100000))
+ W3 <- cor * W1 + sqrt(1 - cor^2) * W2
+ plot(W1, W3, type= "l", ylab = "", xlab = "")
+ }
+ mtext(paste("2-dimensional Wiener-processes (",cor," correlation)",
+ sep = ""), outer = TRUE, cex = 1.5, line = -1)
+ }
> Correlated_Wiener(0.6)
> Correlated_Wiener(-0.7)
Margrabe formula.
Margrabe <- function(S1, S2, sigma1, sigma2, Time, rho, delta1 = 0,
+ delta2 = 0) {
+ sigma <- sqrt(sigma1^2 + sigma2^2 - 2 * sigma1 * sigma2 * rho)
+ d1 <- ( log(S1/S2) + ( delta2-delta1 + sigma^2/2 ) * Time ) /
+ (sigma*sqrt(Time))
+ d2 <- ( log(S1/S2) + ( delta2-delta1 - sigma^2/2 ) * Time ) /
+ (sigma*sqrt(Time))
+ M <- S1*exp(-delta1*Time)*pnorm(d1) - S2*exp(-delta2*Time)*pnorm(d2)
+ return(M)
+ }
Margrabe(100, 120, .2, .3, 2, .15)
[1] 12.05247
> Margrabe(100, 120, .2, 0, 2, 0, 0, 0.03)
[1] 6.566047
we calculate th.e Margrabe price of the option for different values of correlation
Conclusion
The result is not surprising. When the correlation is high, we have the right to switchbetween identical stocks, which, clearly, is worth nothing. When the correlation
is high on the negative side, we have better chances to make a good deal with the
option if things go wrong (which means that if our asset decreases, the higher the negative correlation, the higher the chance that the price of the other asset increases and saves us from loss). In other words, in this case, the option is for insurance rather
than speculation; we do not have to bear the risk from the price change of the other
asset. This is why the option is more valuable when the correlation is negative


0 Comments