Analysis of the return series calculated from
the daily closing prices of Amazon
library("quantmod", lib.loc="~/R/win-library/3.5")
> library("ggplot2", lib.loc="~/R/win-library/3.5")
Warning message:
package ‘ggplot2’ was built under R version 3.5.1
> getSymbols(c("AMZN")).
[1] "AMZN"
> head(AMZN)
AMZN.Open AMZN.High AMZN.Low AMZN.Close
2007-01-03 38.68 39.06 38.05 38.70
2007-01-04 38.59 39.14 38.26 38.90
2007-01-05 38.72 38.79 37.60 38.37
2007-01-08 38.22 38.31 37.17 37.50
2007-01-09 37.60 38.06 37.34 37.78
2007-01-10 37.49 37.70 37.07 37.15
AMZN.Volume AMZN.Adjusted
2007-01-03 12405100 38.70
2007-01-04 6318400 38.90
2007-01-05 6619700 38.37
2007-01-08 6783000 37.50
2007-01-09 5703000 37.78
2007-01-10 6527500 37.15
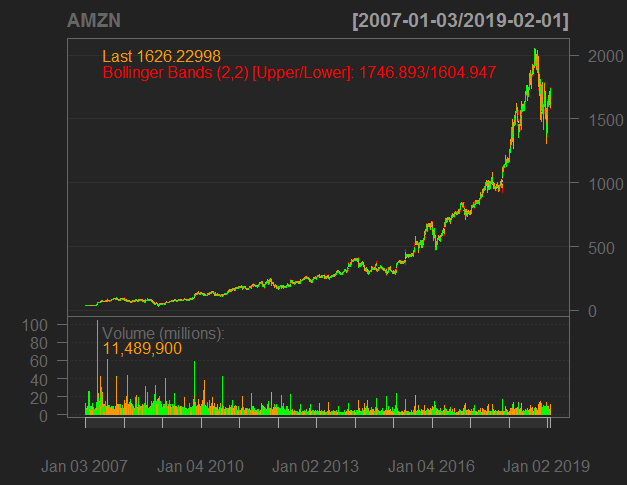
> barChart(AMZN,theme = "white.mono",bar.type = 'hlc')
> barChart(AMZN)

> addBBands(n=2,sd=2,ma='SMA',draw = "bands",on=-1)
> z = y - gamma*AMZN
Error: object 'y' not found
> N <- 10
> x <- cumsum(rnorm(N))
> gamma <- 0.7
> y <- gamma * x + rnorm(N)
> z = y - gamma*AMZN
> library('vars')
> ret <- dailyReturn(Cl(AMZN), type='log')
> par(mfrow=c(2,2))
> acf(ret, main="Return ACF");
> pacf(ret, main="Return PACF");
> acf(ret^2, main="Squared return ACF");
> pacf(ret^2, main="Squared return PACF")

> m=mean(ret)
> s=sd(ret);
> par(mfrow=c(1,2))
> hist(ret, nclass=40, freq=FALSE, main='Return histogram');curve(dnorm(x,
+ mean=m,sd=s), from = -0.3, to = 0.2, add=TRUE, col="red")
> plot(density(ret), main='Return empirical distribution');curve(dnorm(x,
+ mean=m,sd=s), from = -0.3, to = 0.2, add=TRUE, col="red")

> kurtosis(ret)
Error in kurtosis(ret) : could not find function "kurtosis"
> plot(density(ret), main='Return EDF - upper tail', xlim = c(0.1, 0.2),
+ ylim=c(0,2));
> curve(dnorm(x, mean=m,sd=s), from = -0.3, to = 0.2, add=TRUE, col="red")

> plot(density(ret), xlim=c(-5*s,5*s),log='y', main='Density on log-scale')
> qqnorm(ret);qqline(ret);

library("quantmod", lib.loc="~/R/win-library/3.5")
> library("ggplot2", lib.loc="~/R/win-library/3.5")
Warning message:
package ‘ggplot2’ was built under R version 3.5.1
> getSymbols(c("AMZN")).
[1] "AMZN"
> head(AMZN)
AMZN.Open AMZN.High AMZN.Low AMZN.Close
2007-01-03 38.68 39.06 38.05 38.70
2007-01-04 38.59 39.14 38.26 38.90
2007-01-05 38.72 38.79 37.60 38.37
2007-01-08 38.22 38.31 37.17 37.50
2007-01-09 37.60 38.06 37.34 37.78
2007-01-10 37.49 37.70 37.07 37.15
AMZN.Volume AMZN.Adjusted
2007-01-03 12405100 38.70
2007-01-04 6318400 38.90
2007-01-05 6619700 38.37
2007-01-08 6783000 37.50
2007-01-09 5703000 37.78
2007-01-10 6527500 37.15
> barChart(AMZN,theme = "white.mono",bar.type = 'hlc')
> barChart(AMZN)
> addBBands(n=2,sd=2,ma='SMA',draw = "bands",on=-1)
> z = y - gamma*AMZN
Error: object 'y' not found
> N <- 10
> x <- cumsum(rnorm(N))
> gamma <- 0.7
> y <- gamma * x + rnorm(N)
> z = y - gamma*AMZN
> library('vars')
> ret <- dailyReturn(Cl(AMZN), type='log')
> par(mfrow=c(2,2))
> acf(ret, main="Return ACF");
> pacf(ret, main="Return PACF");
> acf(ret^2, main="Squared return ACF");
> pacf(ret^2, main="Squared return PACF")

> m=mean(ret)
> s=sd(ret);
> par(mfrow=c(1,2))
> hist(ret, nclass=40, freq=FALSE, main='Return histogram');curve(dnorm(x,
+ mean=m,sd=s), from = -0.3, to = 0.2, add=TRUE, col="red")
> plot(density(ret), main='Return empirical distribution');curve(dnorm(x,
+ mean=m,sd=s), from = -0.3, to = 0.2, add=TRUE, col="red")

> kurtosis(ret)
Error in kurtosis(ret) : could not find function "kurtosis"
> plot(density(ret), main='Return EDF - upper tail', xlim = c(0.1, 0.2),
+ ylim=c(0,2));
> curve(dnorm(x, mean=m,sd=s), from = -0.3, to = 0.2, add=TRUE, col="red")

> plot(density(ret), xlim=c(-5*s,5*s),log='y', main='Density on log-scale')
> qqnorm(ret);qqline(ret);


0 Comments